By: Arlin Delgado
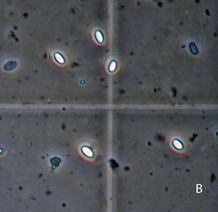
 Visible Nosema spores under 400x magnification. Photo Credit: W. F. Huang
 Nosema is a unicellular parasitic fungus that has become a large focus in research due to the detrimental effects it has not only on the single bee it infests, but the health of a hive as a whole. Researchers across the globe are scrambling to understand how to better predict hive health and combat this fungus to minimize the damaging effects on crop production, and the B.I.P. Lab is no exception. Over the last two years, undergraduate students in the lab have studied various aspects of this research topic, from testing predictors of hive mortality to the variance that stems from different Nosema counting methods.
Students first attempted to find the best predictor of hive health based on load, prevalence or intensity (Goldberg, Riley & Wallace, 2012). Load was defined as the average of 10 Nosema counts per individual bee, while prevalence only recorded the presence of Nosema and intensity looked at the average count per hive, if there was a positive mark for prevalence. A total of 10 bees per colony from 12 colonies were analyzed in all 3 manners after grinding. It is important to note that approximately half of the colonies were considered dead by a second sampling date and bees were sampled from 4 yards (two considered good and two considered bad environments). Statistical analysis revealed that load and intensity were not significant predictors of hive mortality. Prevalence was a statistically significant predictor; however, when placed with other predictors it was not. The environment of the yards may have been a good predictor, but due to possible recording errors no conclusions were drawn.
In the following semester, students continued work on this project to better understand predictors of hive mortality (Ghauri, Connine & Bein, 2013). They found prevalence came close to reaching statistically significant levels and the environment once again played an increasingly greater role in predicting hive mortality.
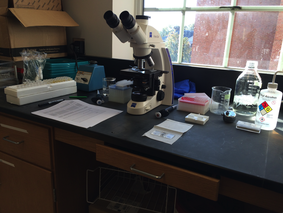
 Work Bench Set Up for Nosema Counting Photo Credit: Arlin Delgado
 Yet, students have also looked into the variability of Nosema infestations at the hive level (“Validation of Nosema Protocol”). The objective of a 3rd project was to compare the variability of the sample bag (30 vs. 100 bees per bag) as well as the variability of counts across researchers. A total of 9 hives with known Nosema infestations (categorized into high, medium, and low infestations) were sampled to create 3 bags of 30 and 100 bees per hive and each bag was counted 3 times per researcher. It was found that as bag size increased there was increasing variability across the mean counts of readers and approximately 17.7% of the variance stemmed from the difference in bag sizes within the same hive. Conclusions showed that as we increase the size of the sample, we increase the uncertainty in our Nosema counting
Taking this into consideration, a fourth project focused on the precision of 4 possible Nosema crushing preparation methods (Delgado, 2014). The current method uses a Pin Roller to crush samples of 100 bees in a tightly sealed Ziploc® Bag. Then 3 other methods were tested using either a Pasta Roller or Mesh bag in combination with Pin Roller or Ziploc® Bag. It was found the use of a Pin Rolled Mesh Bag had high variability and therefore was eliminated from further testing. Likewise, the Pasta Rolled Ziploc® Bag was eliminated due to the statistically significant decrease in lab efficiency. It was concluded that the current method and Pasta Rolled Mesh Bag were comparable in variability and time. After much deliberation, the current method would continue to be utilized for Nosema counting.
While these 4 projects have facilitated a better understanding of how to predict hive health, as well as decrease variability in counting, this semester’s project hopes to indicate if prevalence is a statistically significant predictor. Samples of 10 bees from 20 colonies per sampling period will be analyzed for the presence of Nosema. To add evidence if prevalence is a strong indicator of hive health would allow the BIP team and bee keepers alike to diagnose hive health at earlier stages of infestation and combat this fungus to reverse the deteriorating health trends associated with this parasite.
References:
Delgado, A. (2014). Methods for Nosema Counting [Powerpoint Presentation]. Retrieved from Spring 2014 Student Presentations Folder, Dropbox.
Ghauri, G., Connine, T. & Bein, Eva. (2013) NosemaProject_Aug 2009 [Powerpoint Presentation]. Retrieved from Project Documents Folder, Dropbox.
Goldberg, J.; Riley, C. & Wallace, R. (2012). A New Approach to Nosema [Powerpoint Presentation]. Retrieved from Project Documents Folder, Dropbox.
“Validation of Nosema Protocol”. Retrieved from Nosema Folder, Google Drive.

 RSS Feed